
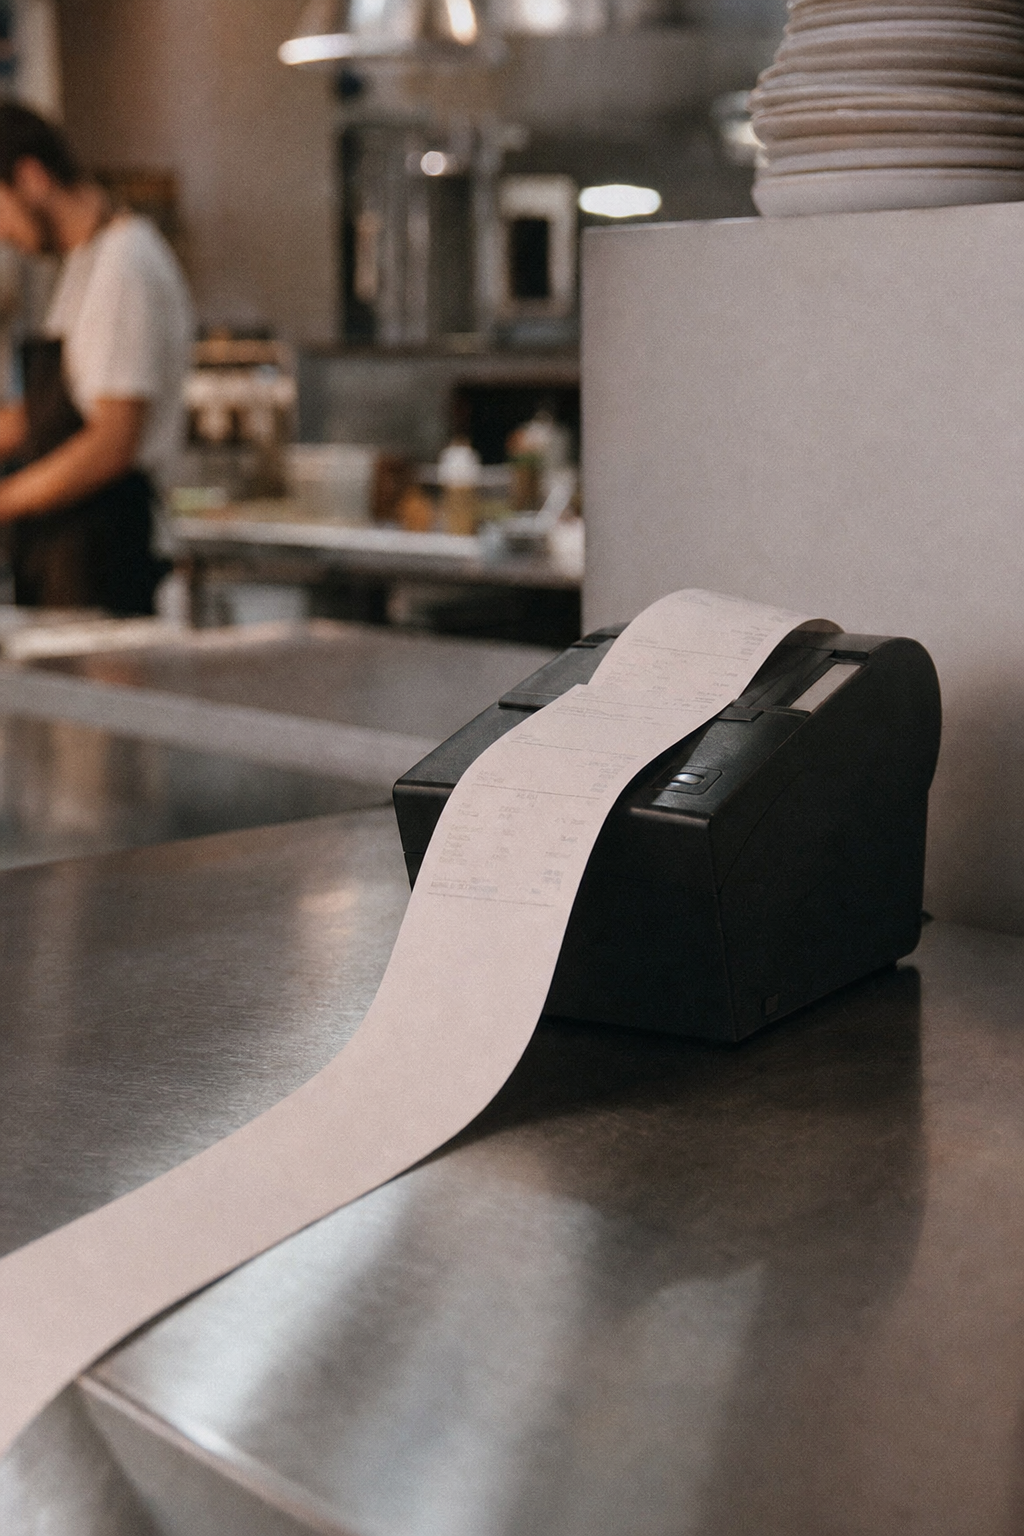
Item-level POS data is the most underused asset in quick service.
Item-level POS data records what sold, with what, at what price, in which daypart, through which channel — order by order. It is the ground truth that revenue reporting averages away, and the raw material for menu, pricing and media decisions.
Every quick-service chain already collects it. Every till, kiosk and app order writes a line-by-line record of the business: the basket, the modifiers, the channel, the timestamp, the discount applied. Millions of these records accumulate daily across a network — and in most chains, they are compressed into a weekly revenue number and filed away.
That compression is expensive. Revenue tells you the business grew 2%. Item-level data tells you why — that the growth came from one combo, in one daypart, through one channel, at the cost of a higher-margin item it cannibalised.
What can item-level data answer that revenue data cannot?
The questions that actually shape the menu and the media plan. Which items carry attach rate — and which only ever sell alone? What does the basket look like when the LTO is in it? Which menu items exist only in one daypart’s baskets? What happens to fries attachment when the combo price moves one unit? Where do kiosk baskets differ from drive-thru baskets — and what does that say about what each screen should promote?
Operators using this level of analysis prune underperforming SKUs, protect their margin items and design menus around demonstrated behaviour. Everyone else engineers menus by committee.
“Revenue tells you the business grew. Item-level data tells you why — and what to do next.”
Where does item-level data create the most value?
Wherever a decision currently runs on averages:
- Menu engineering. Rank every item by margin contribution and attach behaviour per daypart — then let the menu board hierarchy follow the ranking.
- Pricing. Read real price elasticity from transaction history before any price move, item by item, market by market.
- LTO validation. See trial, repeat and cannibalisation within days of launch — the difference between a hit and an expensive rotation.
- Demand forecasting. Item-by-daypart history is the foundation every credible forecast is built on.
- Media measurement. Match screen content and campaigns to the orders that followed, closing the loop between impression and transaction.
Why does so much of it go unused?
Fragmentation, mostly. POS, kiosk, app and delivery orders often live in separate systems with separate item codes; franchise networks add local variation on top. The data exists, but no single team owns the question it could answer — so marketing plans on impressions, operations plans on averages, and finance reads the outcome without seeing the mechanics.
This is why the operating core treats the restaurant-level system — item-level POS validation — as the anchor of the whole operating loop. When every order feeds strategy, forecasting, menu boards and loyalty in one coordinated system, the transaction stops being a receipt and becomes what it always was underneath: the most honest signal in the business, arriving millions of times a day.